Who Gets to Turn Numbers into Evidence?
Turning numbers into evidence is a form of labour – and in the Global South, that labour is unevenly distributed.
Turning numbers into evidence is a form of labour – and in the Global South, that labour is unevenly distributed.
1. Who Gets to Question the Numbers?
By the end of 2018, India’s National Sample Survey Office had completed its 2017–18 Periodic Labour Force Survey (PLFS) – the government’s own instrument for measuring employment. The report was not released. Weeks later, a version leaked to the press showed unemployment at 6.1%, its highest level in forty-five years. Two members of the National Statistical Commission, which had approved the report, resigned over its withholding.1 The immediate dispute was not over a mathematical error in the figure, but over whether the public would be allowed to see it.
The PLFS controversy showed how much political weight a number can carry. Numbers are central to public debate: debt ratios, growth rates, unemployment rates, poverty lines, price indices, and export values help decide whether an economy is ‘recovering’, whether workers are ‘employed’, and whether public spending is treated as ‘affordable’. But withholding a number is only one way to control its political meaning. Numbers can also obscure reality through the definitions, classifications, comparisons, and formats that make them appear neutral.
Unemployment rates are a good example of what numbers can reveal and obscure at the same time. An unemployment rate is never a simple head count of the jobless. It is a ratio between those classified as unemployed and those counted as part of the active labour force. That ratio depends on definitional boundaries: who qualifies as employed, who is actively seeking work, who has stopped searching, who is immediately available to work, and which forms of informal or unpaid labour fall outside the metric.
The rate can fall because employment has genuinely expanded, but it can also fall because discouraged jobseekers stopped searching, because precarious informal work is counted as employment, or because underemployment has been swept into a different statistical bucket. On its own, the number cannot tell us which underlying social process it records.
These examples point to a deeply political problem. Accuracy is only part of it. The deeper question is who has the power to interrogate a number. Who can probe its definitions? Who has the means to audit the denominator, distinguish a count from a rate or an index, or tell a nominal value from a real one? Who can trace a polished indicator back to the realities of labour and class, gender and region, debt and the world market?
These questions have real-world implications that affect the lives of billions. International Monetary Fund (IMF) surveillance and its formally voluntary data-dissemination standards shape the formats through which states report economic data; World Bank lending has financed and shaped the development of national statistical systems; the United Nations’ System of National Accounts defines the international standards for measuring gross domestic product (GDP); and sovereign credit ratings from Moody’s, S&P, and Fitch influence borrowing costs through methodologies whose final judgements are not fully open to public scrutiny.2
This concentration of statistical authority leaves researchers in the Global South in a bind. They may ask how sovereign debt constrains public spending, or how commodity prices bind national production to an unequal world market. But the data through which they must answer those questions are often organised elsewhere, sometimes by the very institutions and standards they seek to interrogate. The pattern is not new. Raúl Prebisch’s account of core–periphery terms of trade3 and Walter Rodney’s account of colonial economies organised for extraction4 point to an older problem: economic domination shapes not only the movement of commodities, labour, and capital, but also the terms through which those movements are counted, compared, and understood. The question today is how that older problem reappears in datasets, indicators, metadata, and institutional standards. Nor does the Global South confront this problem from a single standpoint. A finance ministry technocrat, a business lobby, and a union research department do not approach IMF numbers with the same interests. The question is therefore not only where statistical authority is located, but whose interests its categories and measures serve.
For researchers, movements, and public institutions that have long had to rely on metrics pre-packaged by dominant institutions, the challenge is not simply a lack of data but unequal power to turn raw numbers into evidence. The emergence of AI tools changes this terrain by lowering the cost of that work. But AI’s political significance can only be understood by first looking at the labour that comes before analysis: the choices, checks, and transformations that decide what a number can be made to show.
2. Numbers Are Not Evidence Until Someone Makes Them Evidence
Quantitative research is often imagined as a linear process: the data exist, then they are cleaned, analysed, visualised, and interpreted. This sequence feels intuitive, but it starts too late. Much of empirical inquiry happens before formal analysis begins, in the laborious effort to determine whether a given figure can answer the question in front of it.
A cell value in a table is not yet evidence. It becomes evidence only when connected to a specific research question, a rigorous definition, a unit of observation, a standardised measure, and a basis for comparison. A number may be valid inside its own statistical system and still fail to answer the political question being asked. Recognising when a national total hides deep distributional disparities, or when a trend in money terms hides a change in what that money buys, is part of the conceptual work of quantitative inquiry. So is seeing when a formal head count of workers leaves out labour that is socially necessary.
This connective labour – the work that bridges raw figures and substantive claims – is measurement work. It is the labour of transforming raw administrative or statistical outputs into evidence. Its inputs might be a PDF table, a brief metadata note, or an isolated time series. Its outputs are explicit variables, verified transformations, documented sources, and defensible comparisons.
The term is specific to data, but the kind of translation it refers to has a longer history. Bowker and Star showed that classification systems are built through political and institutional labour.5 Marx showed how capitalism translates different kinds of concrete labour into abstract, exchangeable value.6 Measurement work names a related translation: the process by which raw figures are made into evidence that can circulate as public truth.
Naming this labour matters because it reframes the primary question from ‘do we have the numbers?’ to ‘what has been done to make these numbers usable as evidence?’
GDP, for instance, can be expressed as an absolute level, a year-on-year growth rate, a per capita value, a nominal series, or a deflated real index. A poverty line can make material deprivation visible, but where it is drawn also decides how many people count as poor at all. A consumer price index captures inflation, yet its political implications diverge dramatically depending on whether the focus is on food security, fuel costs, real wages, or basic household survival. These are not minor technical adjustments. They decide which parts of social life a number can show, and which it leaves out.
Take the World Bank’s ‘Pink Sheet’ on commodity prices.7 The downloaded annual workbook is a complex file containing multiple sheets: nominal prices, real prices, price indices, and weight structures. A researcher studying agricultural dependency has to choose which version of the price to use. Should they track the price as it appeared at the time, or adjust it to show its purchasing power across years? Which commodity and unit of measure fit the question? This selection is measurement work. It can make the same decades look like recovery – or like a long decline in what those prices could actually buy.
Similarly, a basic GDP growth series can support very different, even contradictory, arguments depending on how it is handled. While a raw annual rate highlights short-term volatility, a three-year moving average smooths out short-term fluctuations to expose cyclical trends, and a five-year average makes longer trends easier to see (Figure 1). The underlying data remain the same, but the choice to aggregate or smooth them is a conceptual intervention. Without the technical capacity to construct these alternative measures, a research team is forced to inherit the version used in official press releases to frame national performance.
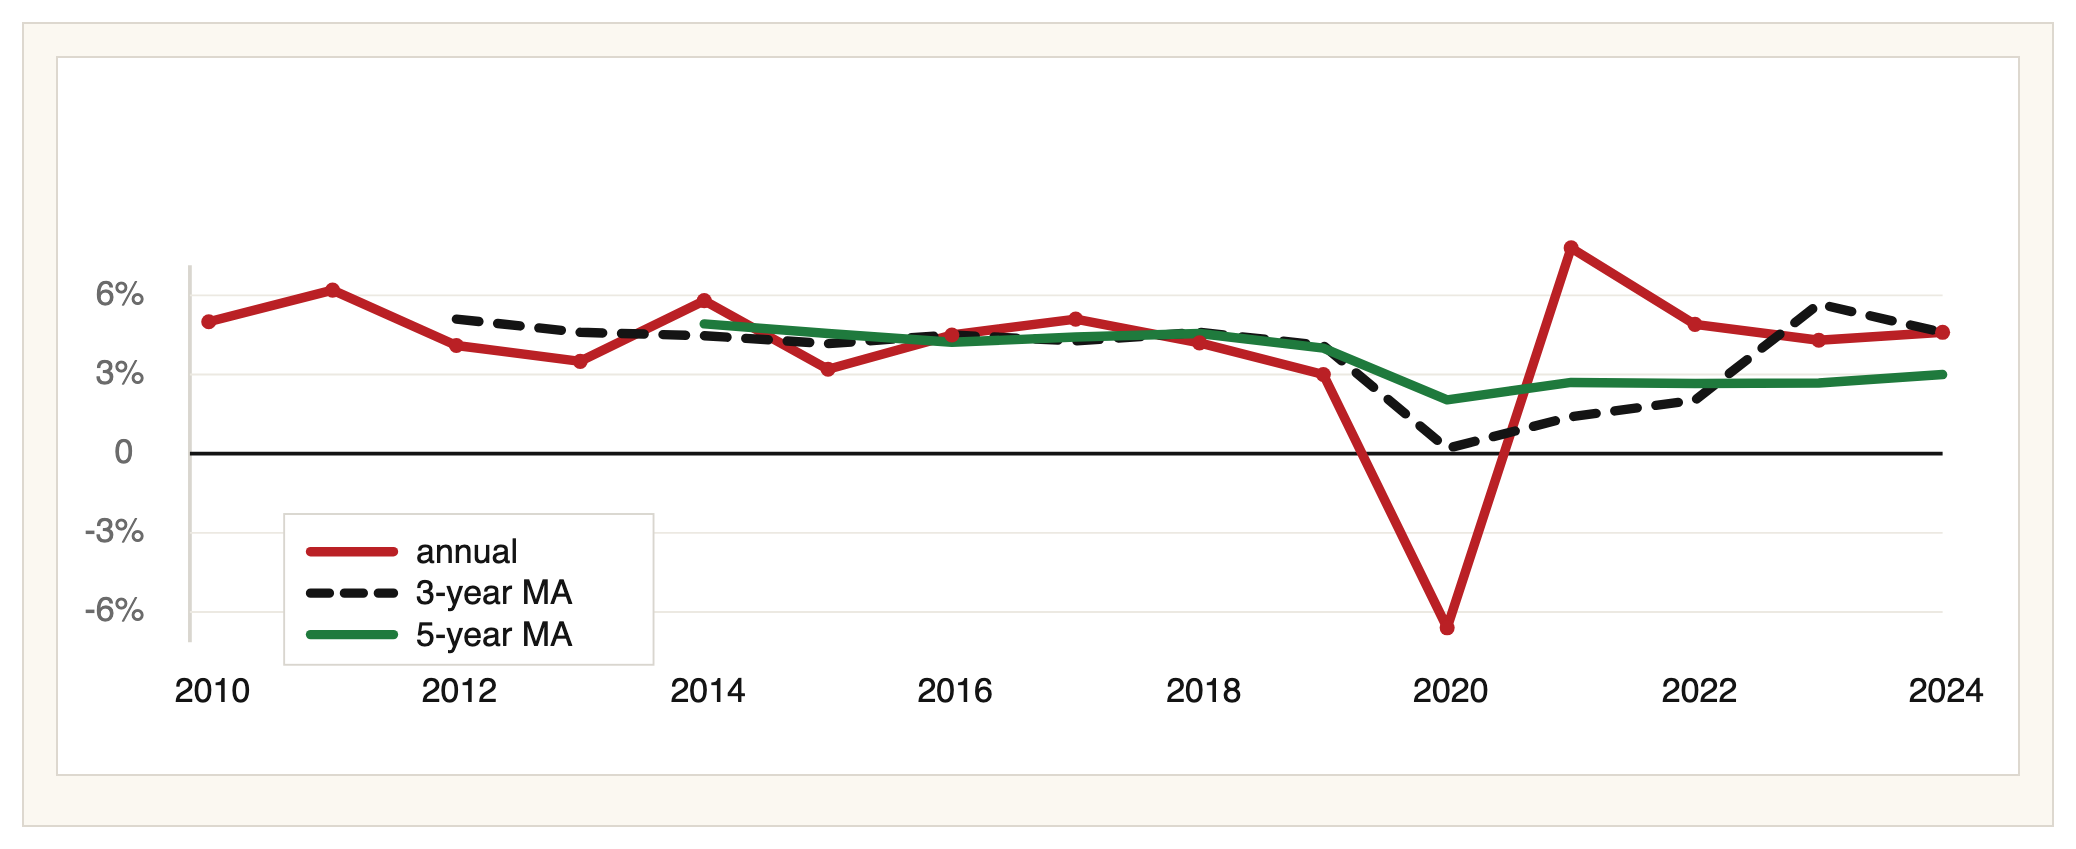
Figure 1. Real GDP growth, read as the annual rate and three- and five-year moving averages (illustrative constructed series, per cent per year; not any specific country).
None of this makes statistical metrics meaningless. It means their authority rests on the chain that connects a raw value to a public claim.
Yet this chain is deeply unequal. Well-funded institutions can spread the pre-analytical labour across dedicated data teams, advanced software pipelines, and robust documentation systems. Researchers, social movements, and public agencies in the Global South often have to carry the sequence themselves: locating raw files, auditing sources, deconstructing tables, writing code, validating totals, and defending their findings in public debates.
This division of labour determines which questions can be asked in the first place. If researchers cannot verify the construct behind a number, an inquiry may never progress to formal analysis. If a spreadsheet cannot be reshaped into structured evidence, the patterns inside it may remain locked away from public debate. When only a handful of well-funded organisations can perform this translation at scale, they retain the power to define economic and social reality through numbers.
Measurement work is a cornerstone of quantitative research capacity. It is not a preliminary chore, but one of the conditions that make empirical inquiry possible.
Yet this foundational labour is routinely erased. The polished indicators in global databases appear as finished facts, with the decisions behind them pushed out of view. This erasure creates two barriers. It discourages researchers from interrogating official statistics, and it leaves them without practice in handling raw administrative data. Often, the numbers exist, but they arrive in formats that are hard to question. A table may be easy to read and still be difficult to check, compare, or reuse.
3. A Readable Table Is Not Yet Data
The gulf between a presentation table and an analysis-ready dataset is visible in a typical worksheet on labour-force indicators (Figure 2). The sheet looks orderly: the two sexes run across the top, sectors down the left, and three related blocks – labour-force participation, work, and unemployment – are stacked one under another. A researcher can read it and a spreadsheet program can display it. But tools such as R, Python, or SQL cannot safely treat it as data, because the meaning of each value is carried by position, formula, and block order rather than by explicit variables.
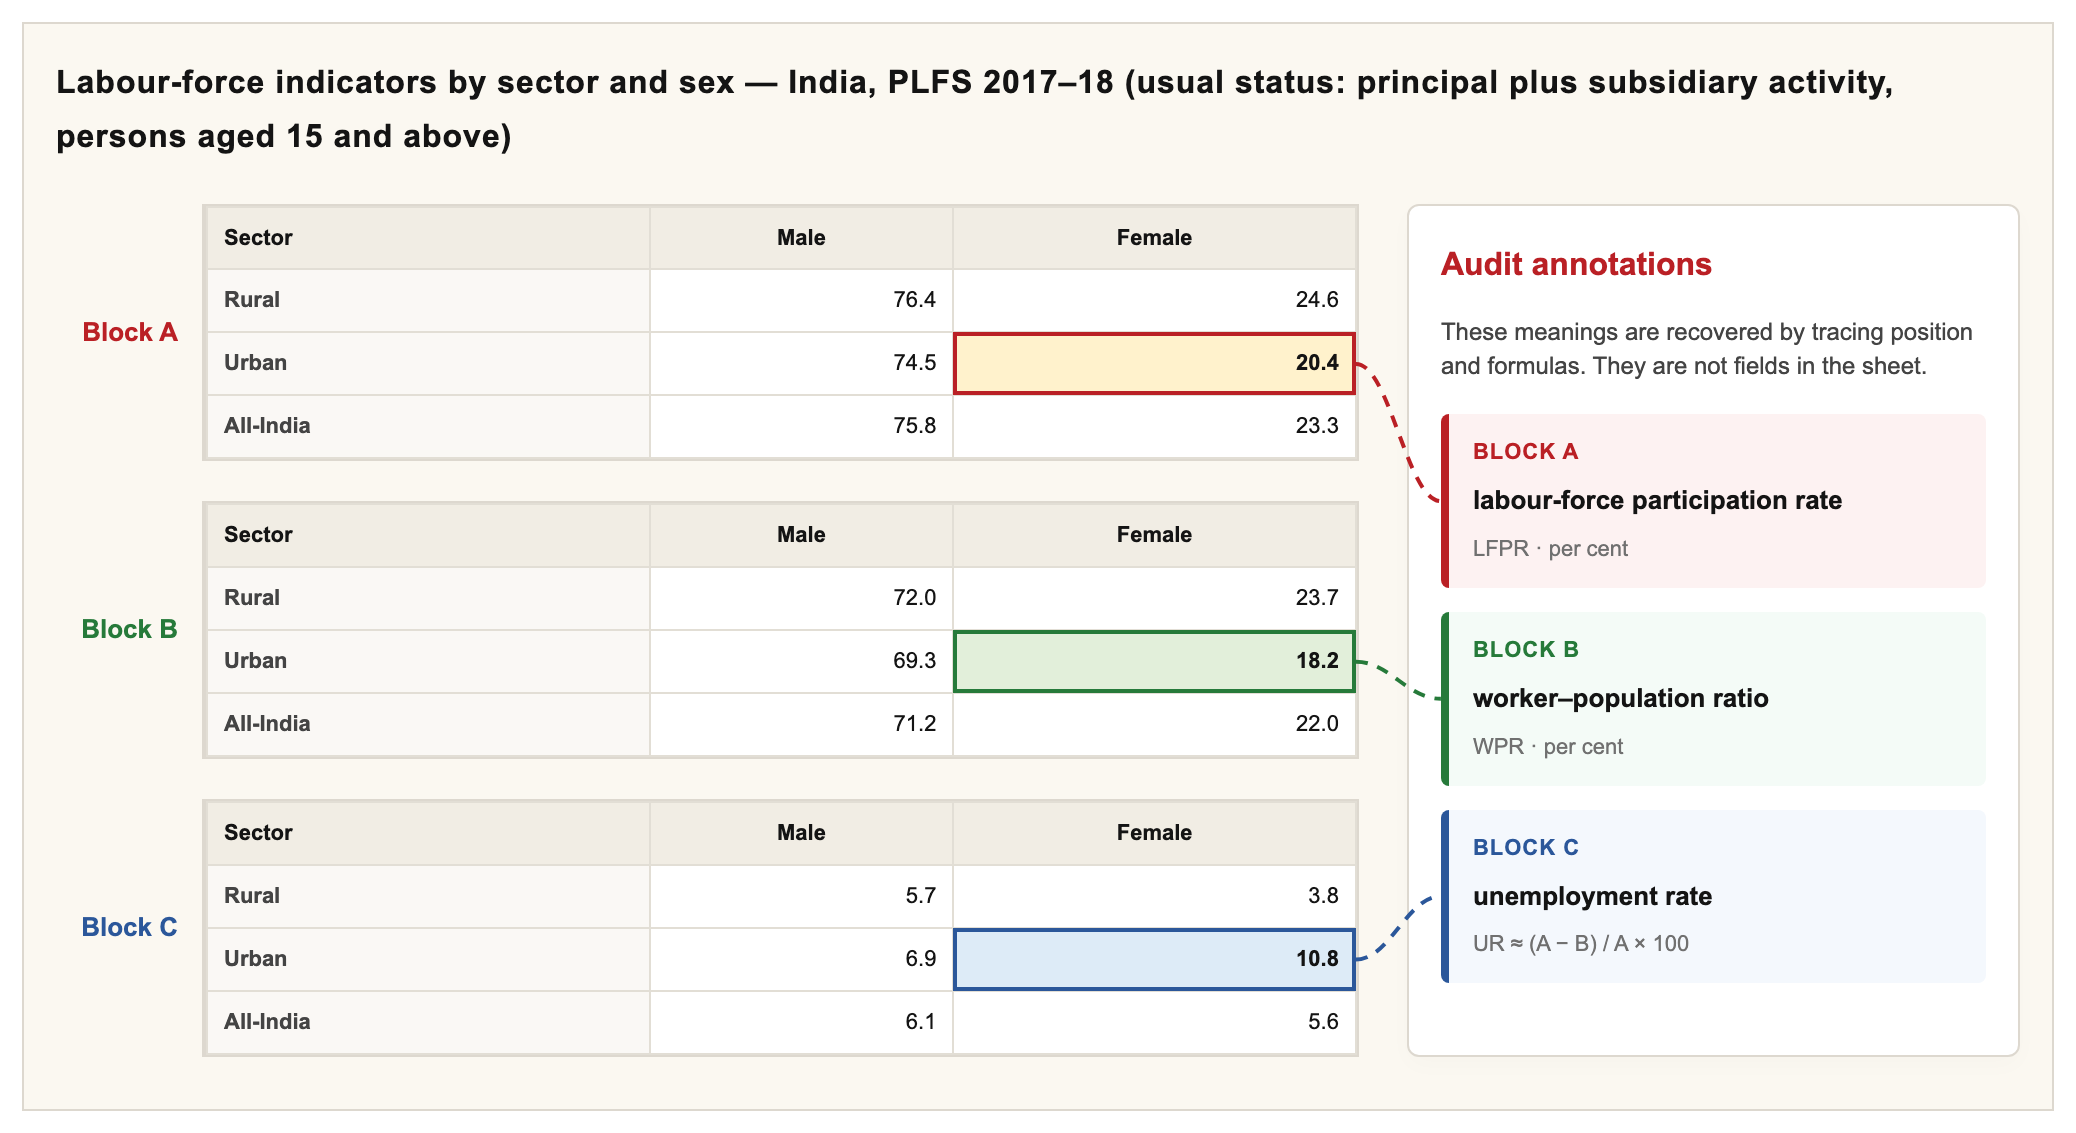
Figure 2. Labour-force indicators by sector and sex, India PLFS 2017–18 (presentation worksheet; usual status – principal plus subsidiary activity; persons aged 15 and above; rates in per cent).8
In the example above, the labour-force participation rate, the worker–population ratio, and the unemployment rate appear in matching positions across separate blocks. To understand how they relate to one another, the reader has to follow the layout and formulas by hand. That may be enough for one careful reading, but it is not enough for analysis that another researcher can repeat and verify.
An analysis-ready dataset has to be organised differently. The meaning of each number must be built into the dataset itself: the sector, sex, measure, unit, and value should appear as explicit fields, not as clues scattered across the layout. Definitions and formulas should travel with the measure as metadata, rather than be inferred from where a number sits in the grid. The question shifts from ‘can I see the right number near the right label?’ to ‘can another researcher check, group, compare, and reproduce the record without guessing?’ Reshaping the sheet into that form (Figure 3) turns a human-readable layout into machine-checkable evidence.
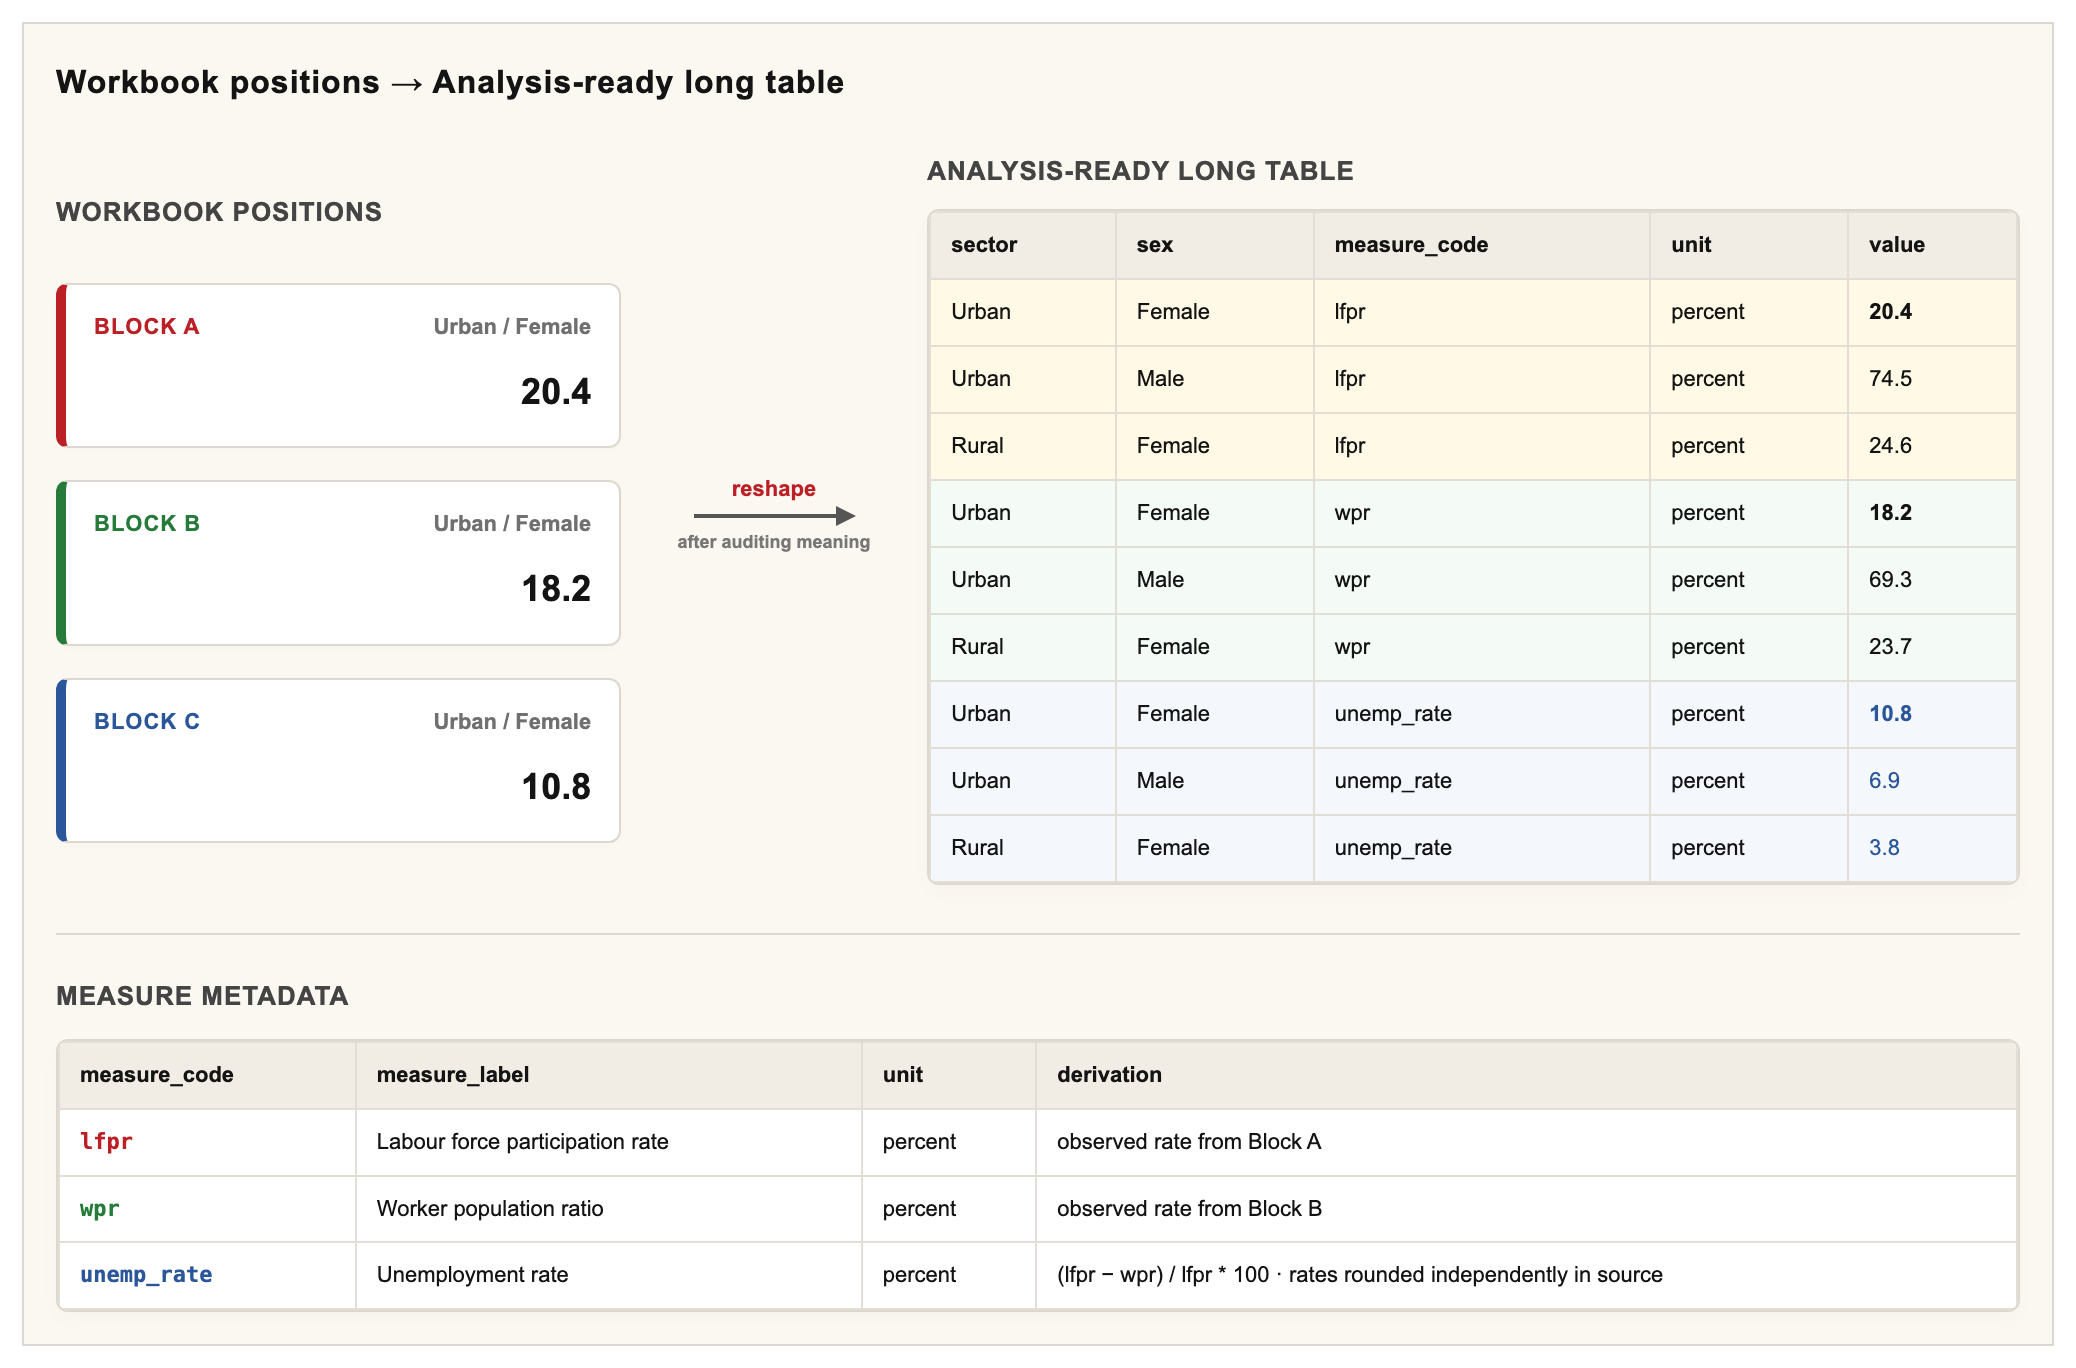
Figure 3. From workbook layout to an analysis-ready long table, India PLFS 2017–18 (usual status – principal plus subsidiary activity; persons aged 15 and above; rates in per cent; data and definitions as in Figure 2).
Once the measure is explicit, the evidence chain can be verified and inspected. Code can test whether totals add up, whether categories repeat consistently, whether rates match their inputs, and whether cases are missing. The record that travels with the dataset – source, layout, definitions, formulas, exclusions, checks – lets another researcher trace each step.
Without that structure and record, a chart may look polished while resting on a number whose meaning was guessed from its place in the table. The evidence cannot be independently checked or reliably reused beyond the person who cleaned it. The same opacity recurs across government reports, international databases, survey summaries, commodity-price sheets, and statistical PDFs – wherever the conditions that make numbers usable as evidence are hidden in layout, metadata, definitions, and institutional practice.
4. AI Lowers the Cost of the Work before Analysis
In this context, AI matters because it lowers the cost of pre-analytical labour. It is most useful for researchers who have a clear question, understand the statistical constructs, and can judge the political stakes, but lack years of formal training in data engineering.
For resource-constrained research teams, a major bottleneck is the difficult transition from a published table to a dataset that can be searched, checked, and analysed. Researchers have to identify the implicit variables, write the code that reshapes the table, verify the formulas, and record where each value came from. Many promising inquiries are abandoned at this stage not because the question is weak, but because the path from source format to evidence is too costly.
AI can help at several points in this transition, so long as each step remains open to human inspection.
Reading the Layout. AI can reduce the friction by helping researchers map the structure of the source data. A researcher can describe a table in plain language – quarters across columns, age cohorts down rows, sex categories repeated under each period, and measures stacked in blocks – and ask the system to propose a structure: period, age group, sex, measure code, unit, and value. The point is not to outsource the design, but to get a first draft that can be inspected, corrected, and finalised faster than starting from a blank script.
Drafting the Code. AI can help turn the researcher’s plan into a first working script. A researcher can explain what needs to happen to the table: move repeated headings into their own columns, combine related tables or lookup lists, remove footnote markers and other recurring text patterns, make labels consistent, turn numbers stored as text into usable values, or record where the original figures came from. The script still has to be checked against the source. But AI can lower the barrier between knowing what needs to be done and being able to run the code that does it.
Running the Checks. AI can also help with verification. A researcher can ask it to generate validation checks: Do sex categories add up to the listed totals? Do regional sub-aggregates reconcile with national aggregates? Does a rate match its numerator and denominator? Were any rows dropped during the reshaping process? These checks are the primary way in which a small team can prevent an empirical claim from drifting away from its material grounding.
Documenting the Work. AI can help turn a messy, interactive data-cleaning session into a structured record of the work: which sheet and cell ranges were read, which rows were excluded, how variables were renamed, what assumptions were made, and which validation tests succeeded. That record can be written in plain Markdown, JSON, or any other format the team can review. Without it, the analysis remains an isolated craft. Researchers are forced to reconstruct the same steps again, while institutions with stronger data-management systems retain the authority to define the mainstream narrative.
Diagnostic visualisations extend the same logic. Line charts, bar charts, and histograms can reveal structural breaks, duplicated periods, missing categories, or unusual outliers while evidence is still being made, before a claim has been written around a mistaken pattern.
One political caution belongs here: cleaning sensitive administrative data with a foreign AI tool can make those data newly legible to the company running the model, depending on its retention practices. The same act can build research capacity and open a new point of extraction.
Taken together, these steps place AI inside the measurement workflow rather than above it (Figure 4). AI can lower the cost of moving from a source to a structure, a set of checks, and a record. But the work that gives numbers public meaning – confirming the source, checking definitions, and interpreting the result – stays in human hands.
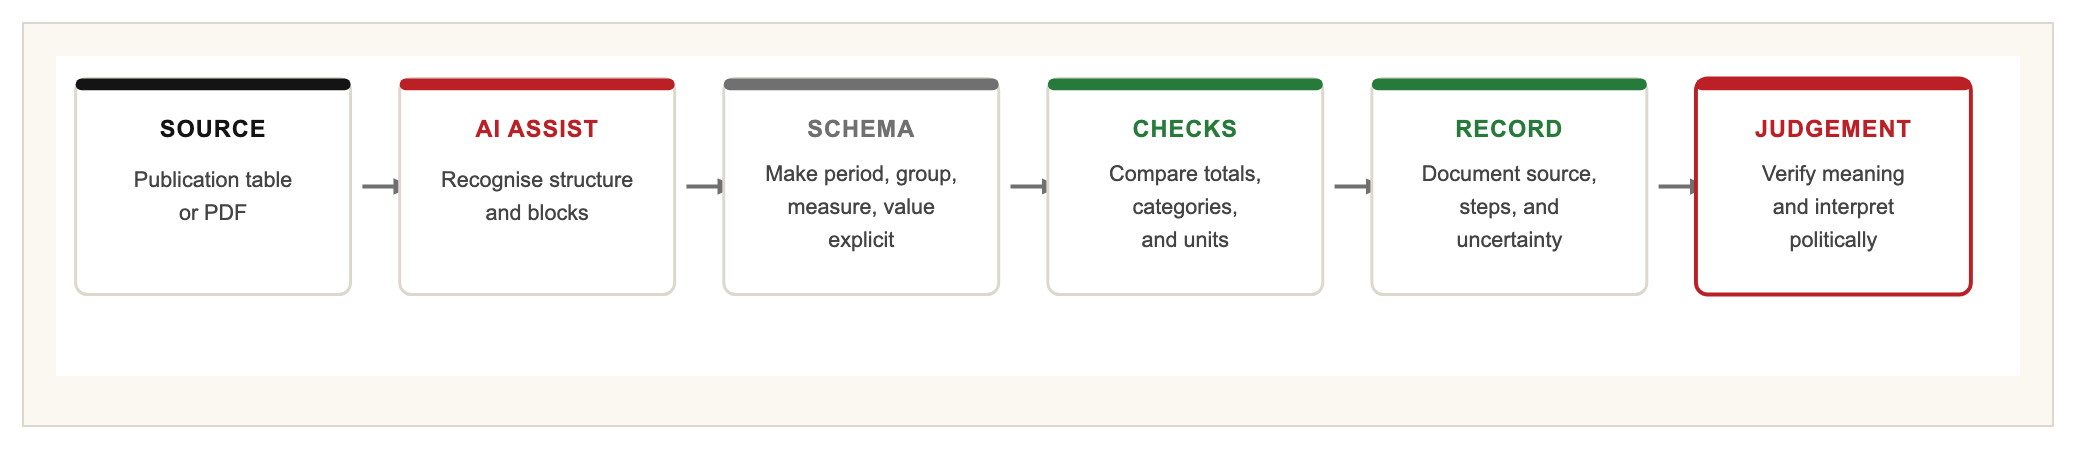
Figure 4. Where AI enters the measurement workflow (schematic; no data).
AI can automate parts of the quantitative workflow, but it cannot replace quantitative research as a whole. Nor does it make programming obsolete. The political opening is that researchers can spend less time fighting syntax and more time on statistical definitions, conceptual design, and political-economic interpretation.
In practice, this means that local research teams, trade unions, and regional public institutions in the Global South can now transform dense, poorly formatted administrative reports into auditable databases that others can inspect, reuse, and contest. This extends the Bandung Circuits’ AI for Social Science (AI4SS) framework into the terrain of measurement, applying its concern with research sovereignty to the work of turning numbers into evidence.9
5. AI Cannot Replace Judgement
Making data preparation easier is not the same as replacing intellectual judgement.
An AI system can reshape a file without comprehending its substance. It can infer a tabular layout without knowing whether a given value is a numerator, denominator, total, rate, share, or index. It can produce a clean dataset from a flawed premise. It can accelerate research, but it can also accelerate structured error.
The core principle remains: AI can transform the file, but the analyst must verify what the file actually represents.
Verification is where statistical definition, economic interpretation, and political responsibility converge. Researchers must still decide what activities qualify as labour, which denominator belongs to a rate, whether historical categories remain comparable over time, whether a nominal series must be adjusted for inflation, and whether a chosen price index genuinely addresses the research question. They must also ask whether an official indicator obscures informal work, unpaid care, ecological degradation, or class distribution.
The same limit appears in research on informal work. An AI system can isolate categories such as self-employment, own-account work, or contributing family labour. But it cannot determine whether a category is best understood as an independent livelihood, disguised wage labour, a household survival strategy, or a position of acute subordination within a broader chain of extraction. Translating a statistical category into a concrete social relation requires political-economic judgement. No machine can assume responsibility for how researchers interpret class, value, dependency, or exploitation.
AI can recommend validation checks, but it cannot discern which discrepancy matters politically. A small mismatch in a total may be a rounding issue; a denominator that quietly excludes migrant workers may change the social meaning of the entire rate. AI can render a chart, but it cannot take responsibility for the public claim attached to it.
Using AI responsibly does not mean outsourcing judgement to an algorithm. It means embedding the machine within a disciplined research workflow – checking sources, reconciling totals, documenting each step – and interpreting the result politically. The more powerful these computational tools become, the more clearly researchers must understand their limits.
6. From Data Access to Research Capacity
By this point, the problem is no longer only whether data can be accessed. It is whether researchers have the capacity to turn those data into evidence that can be tested and defended. A dataset may be public and still be politically unusable if researchers lack the time, tools, concepts, and institutional support to work with it. What matters is who can sustain the whole chain: formulating the question, structuring the data, validating transformations, interpreting results, and carrying findings into public debate.
If knowledge production has its own ‘means of production’, then quantitative inquiry is no exception. It requires data and software, statistical concepts and economic theory, infrastructure and documentation – and, above all, institutional time. We call this broader ensemble of conditions the means of quantitative inquiry. It is not a single software package, but the collective capacity to interrogate numbers. Measurement work is a foundational, yet often hidden, layer of this capacity, the point where the structural conditions of quantitative inquiry first become labour.
The central change is not in the questions researchers ask, but in the resources required to answer them with evidence. By lowering that resource threshold, AI can change who builds and defends an evidence base. The first shift is in wider access to materials. A research team that once stopped at a scanned PDF table can now build an auditable database. The second is in deeper access to statistical constructs. A civil society researcher who once had to accept a pre-packaged external indicator can now dismantle and examine its numerator, denominator, and measurement logic. The third is the capacity to build an evidence base of one’s own. A local public institution that once passively consumed international classifications can now test whether those frameworks align with its mandate and build rigorous counter-evidence when they do not. The United Nations Economic Commission for Latin America and the Caribbean shows what that third capacity looks like when sustained at an institutional scale. Prebisch directed it from 1950 to 1963, and it has produced alternative development statistics for the region for nearly eight decades.10
This is, fundamentally, a question of methodological sovereignty. It does not mean that every institution should invent its own statistics or ignore comparability. It means having the capacity to examine inherited measures, test whether they answer local and regional questions, document alternative choices, and make those choices accountable to public argument. For a graduate student, this may mean reproducing an official chart instead of simply citing it. For a union, research institute, or public agency, it may mean maintaining an alternative evidence base that can survive public scrutiny. Kerala’s People’s Plan Campaign, launched in 1996, is a working example of that balance. Local bodies gathered their own data and set their own development priorities, within a common planning framework that kept plans comparable across the state – and the decentralised planning it built continues under the Kerala State Planning Board.11
Methodological sovereignty matters most where statistics decide a country’s future. In Pakistan – as Tricontinental: Institute for Social Research documents in dossier no. 69, How the International Monetary Fund Is Squeezing Pakistan – the IMF has made its lending conditional on austerity: removing electricity, gas, and fuel subsidies, raising interest rates, and letting the market set the exchange rate.12 The Fund justifies these conditions through an aggregate assessment of debt sustainability. Its judgement of what is ‘sustainable’ reaches the household as the price of cooking gas and electricity. To show how that burden is distributed, local researchers and trade unions need the capacity to work with household survey microdata, reweight price indices according to local consumption patterns, and estimate the effects of the proposed cuts on different groups, particularly working-class households. Owning the means of quantitative inquiry allows researchers to do more than react to the IMF’s claims: they can challenge its arithmetic with evidence that withstands technical scrutiny and equip unions, movements, and governments prepared to contest its prescriptions.
What AI changes depends on who deploys it. In the hands of dominant institutions, it can produce the same pre-packaged indicator narratives at a faster rate. In the hands of scholars, trade unions, social movements, and public agencies in the Global South, it can widen who is able to build and defend an evidence base. That wider access does not mean lower standards. It requires clearer definitions, more traceable data lineages, more reproducible transformations, more explicit verification protocols, and more responsible interpretation. The objective is not to bend numbers to a predetermined narrative, but to let more researchers check what the numbers can and cannot say.
7. Who Sets the Terms of Counting?
Rigour matters because numbers carry power in public life. But not everything of value should be turned into a metric. Some relations of solidarity and subsistence resist counting, and should. The narrower claim is that whoever sets the terms of counting holds real power, and that power should not sit only in the North. That is the test to hold AI to as well: not AI thinking for researchers, but more researchers gaining the conditions to think with numbers.
Who gets to interrogate the numbers? Who gets to turn numbers into evidence? Who gets to use that evidence to challenge frameworks arranged by others? In the Global South, methodological sovereignty begins there: in the capacity to question inherited numbers, defend the evidence built from them, and mobilise it for political and social emancipation.
Notes
[1] Periodic Labour Force Survey (PLFS) 2017–18, National Sample Survey Office, Ministry of Statistics and Programme Implementation, Government of India (report released 31 May 2019). On the government’s withholding of the report and the resignation of two National Statistical Commission members on 28 January 2019, see Business Standard, ‘Unemployment rate at four-decade high of 6.1% in 2017–18: NSSO survey’ (31 January 2019), business-standard.com; and The Tribune, ‘NSC controversy’, tribuneindia.com.
[2] On international data standards and their reach: IMF Dissemination Standards Bulletin Board, dsbb.imf.org; United Nations System of National Accounts, UN Statistics Division, unstats.un.org/unsd/nationalaccount. On World Bank financing to build or reform national statistical systems, see the World Bank’s Statistical Capacity Building Program (STATCAP), worldbank.org. On sovereign rating methodologies – which combine institutional, economic, external, fiscal, and monetary assessments into an indicative rating level, allow specified supplemental adjustments, and leave the final determination to a rating committee – see S&P Global Ratings, Criteria | Governments | Sovereigns: Sovereign Rating Methodology, 18 December 2017.
[3] Raúl Prebisch, The Economic Development of Latin America and Its Principal Problems (Lake Success, NY: United Nations Economic Commission for Latin America, 1950).
[4] Walter Rodney, How Europe Underdeveloped Africa (London: Bogle-L’Ouverture Publications, 1972).
[5] Geoffrey C. Bowker and Susan Leigh Star, Sorting Things Out: Classification and Its Consequences (Cambridge, MA: MIT Press, 1999).
[6] Karl Marx, Capital, Volume I (1867), especially Part I on the commodity and the value-form.
[7] World Bank, Commodity Markets ‘Pink Sheet’ (annual commodity price data), Commodity Markets Outlook, worldbank.org/en/research/commodity-markets.
[8] All three blocks use PLFS 2017–18 values in usual status – principal plus subsidiary activity (the survey’s ‘ps+ss’ basis) – for persons aged 15 years and above: labour-force participation rate (Statement 8), worker–population ratio (Statement 11), and unemployment rate (Statement 32 and Appendix Table 18, ‘age groups: 15 years and above’). National Sample Survey Office, Annual Report, Periodic Labour Force Survey (PLFS) 2017–18 (2019), mospi.gov.in. Each rate is estimated and rounded independently in the source, so the unemployment rate matches the gap between the labour-force participation rate and the worker–population ratio, expressed as a share of the participation rate, only up to rounding.
[9] See also ‘A Systematic Method for Controlling AI Writing Style’, thetricontinental.org, and ‘How to Analyse and Critique Research with AI’, thetricontinental.org.
[10] United Nations Economic Commission for Latin America and the Caribbean (ECLAC/CEPAL), established 1948; Prebisch directed it from 1950 to 1963. See CEPAL, ‘Prebisch and ECLAC’, biblioguias.cepal.org.
[11] On Kerala’s People’s Plan Campaign, launched 17 August 1996, and its decentralised planning, see T. M. Thomas Isaac with Richard W. Franke, Local Democracy and Development: People’s Campaign for Decentralized Planning in Kerala (New Delhi: LeftWord Books, 2000), especially chs. 5–7 on the development reports, project formats, and plan documents; and Kerala State Planning Board, Decentralised Planning Division, spb.kerala.gov.in.
[12] Tricontinental: Institute for Social Research, Dossier no. 69, How the International Monetary Fund Is Squeezing Pakistan (17 October 2023), thetricontinental.org; for the Fund’s own framework, see IMF, Pakistan: Request for a Stand-By Arrangement, IMF Country Report No. 23/260 (July 2023), imf.org, which includes the debt sustainability analysis.
Author |
Editors |